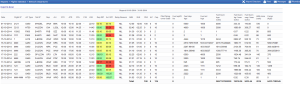
Networks Departures
It is a complex report which shows differences between scheduled times and actual times (both: departure & arrival) in a selected period of time in the filter. You can see that difference in columns Dep Diff and Arr Diff.
Colours indication in the report:
- green - difference between STD & STA or ATD & ATA is ≤ 3 min.
- yellow - difference between STD & STA or ATD & ATA is >3 & ≤ 15 min.
- red - difference between STD & STA or ATD & ATA is >15 & ≤ 60min.
- black - difference between STD & STA or ATD & ATA is > 60 min.
Column ABH shows difference between ATA and ATD (i.e. ATA = 14:45, ATD i= 12:00 so ABH = 02:45)
It is possible to export this report to Excel, where you can also find additional section Network Summary, which is divided into 2 main tables: Delay on Departure & Delay on Arrival showing a number of legs and percentage of flights on time, delayed and cancelled.
Right below there is another table, where Leon displays data such as: total pax, number of flights, average load (total pax divided by number of flights), available seats and load factor (percentage from total pax divided by available seats).
Items in the table Supplier Service Provision need to be filled in manually.

