This is an old revision of the document!
CHARTS
It is now possible to show various charts in sections: WIZARD REPORT, EMAIL TEMPLATES and DOCUMENTS MANAGER.
You can show various charts, by using QuickChart Documentation web service that generates chart images, which are suitable for embedding in email, SMS, chatbots, and other formats.
The below example made in Wizard Report shows wide range of possibilities of this feature.
WIZARD REPORT
The screenshot on the right shows how Wizard Report can generate a 'Revenue report' displaying charts per an aircraft. The chart is type 'doughnut' but you can as well use 'pie' or 'radar' types. The requirement is, that the report needs to be created in the scope 'Flight'.
You can choose the width & the height of the chart by changing items: width=xxx, height=xxx
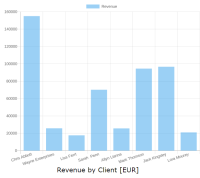
You can also create such report per a client and it can be displayed as i.e. 'bar' type or 'line' type (see screenshots).


